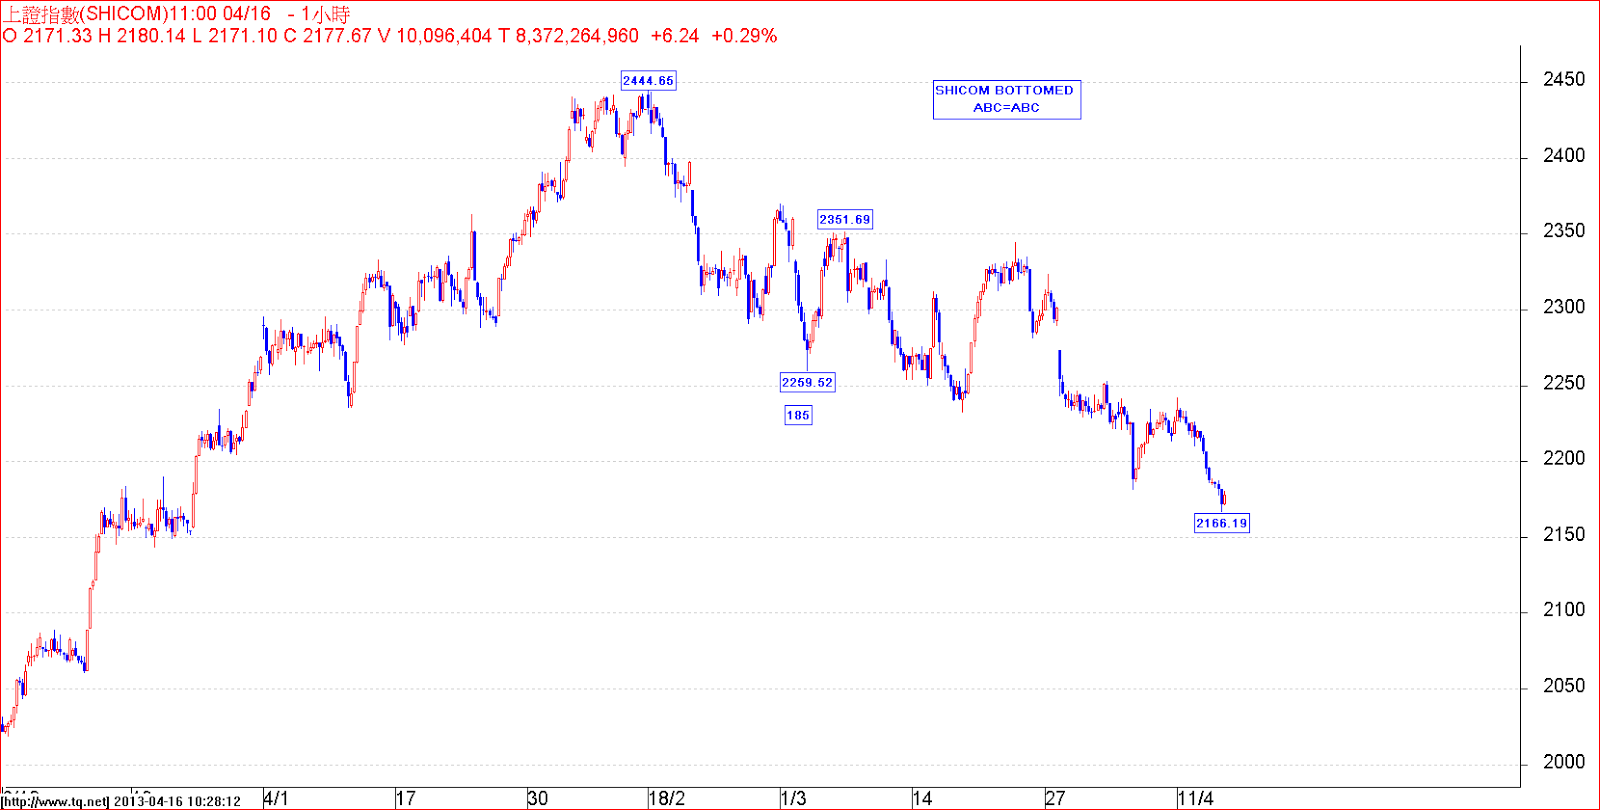
HSIF gap up today reaching 23135. We can see a poossible 5 waves structured finished.
See calculations:-
1/- Wave 1=22022-21306=716
wave 4 =22417
projected wave 5=22417+716=23133
2/- projected wave 3=22072-21595=477x1.618+22007=22778 +/-3 pts
3/- wave 5of 5 is 1.618 of wave 1 of 5
china's market shows weakness compared with global recovery. Today's top has its technical implication.
We decide to take at least 50% of profit.and buy back after correction finished. Any price above 23160 (hsif) and 2255 (shicom) should regard this prediction damn wrong.
賣膠者講嘅嘢自然喺'膠膠'哋咖啦,不可盡信更不構成買賣建議: >P " HE WHO KNOWS NOT WHAT HE RISKS =RISK ALL"
2013年5月8日星期三
2013年4月19日星期五
2013年4月16日星期二
2013年4月15日星期一
2013年4月11日星期四
Minimal April Target 22800
HSIF Gaps up today that traps all Guys expecting for a down side. This force will not stop until this sinking force surrendered. We expect minimum target of April will be at least 22797. It will be conifirmed if today's gap not being filled within today. Late comers will use a few points below 22139 (upper side of the Gap) as protective stop.
Happy Trading
Happy Trading
2013年4月8日星期一
2013年3月20日星期三
Critical Moment
It touches important trendlnes originated from 18-2-2018. Best to break this trendlines with a gap up!!
2013年3月18日星期一
Looking for a rebound
See this calculations:-
1/- 24000- 22364=1636x0.786=1286-23241=21955
2/- 24000-18649=5351x0.382=2044-24000=21956
3/- 23482-22364=1119x1.382=1119-23483=21936
4/- 24000-22364x1.27-24000=21922
US futures over-reacted.
It could be an important low
Low of today already in, BUY!
2013年3月17日星期日
2013年3月14日星期四
2013年3月13日星期三
LOSING TRADE OF TODAY AND PLAN FOR TOMORROW
This trade caused a lost of 30 points.
Background of trade.
1/- Day closes of the previous two days are above 23050 which is regarded by me as a breakthrough of an uptrend.
2/- One five waves structured of 873 points originated from 22368 was completed topped at 23241 which length of wave 1 equals to wave 5 and 1.382 of the former wave (23001-22364=637x38.2%=243+23001=23244 +/- 3 pts.) A deeper correction was anticipated.
But to my opinion , this finished wave was only a 3-1 wave, only one part of the whole 3rd wave.
3/- 22857 is the intersecting point of the Black and Green Trendlines.
4/- we hoped that, after a rapid intraday correction, it would go back to 23050 once again making 3 days in a row.
Unfortunately, we failed the trade but our lost was limited with a protective stop.
Tomorrow, we will buy again if the open is not lower than today's low 22791.
Trading Range: 23050--22791 = 259
Buying Range: 259/5+22791=<22843 p="">Happy Trading
22843>
2013年3月12日星期二
2013年3月9日星期六
USD/Yen Topping?
Yen maybe topping out tonight.
Calculations as belows:-
1/- 82.82-77.10=5.72x2.618=14.97+81.69=96.66
2/- 84.17-76=8.17+88.03=96.20
3/- 84.17-76=8.17x2.382=19.46+77.10=96.56
4/- 84.47-75.54=8.63x2.236=19.29+77.10=96.39
5/- 82.82-77.10=5.72+91.06=96.78
Average=96.66+96.20+96.56+96.39+96.78/5=482.59/96.518
Target:91.06/88.03/86.9/84.6
Stop: 97.50
Happy Trading
2013年3月6日星期三
6-3-2013 HSIF TRADING PLAN
Today's top is 22733 and it can be easily calculated with wave's target projection formula. (see illustration).Its too early to say market bottomed, however, up momentum was not interrupted by the afternoon's corrections. . Today's close stays above the Average Pivot of the last 3 day is 22564 (22645+22476+22573/3) and its also well above all supporting trend lines and channel. The chance of double bottom (22364 & 22368) is still good. Our Target of tomorrow is 22770 and 22895.
We prefer to buy if index fall in between 22480 and 22540.
Happy Trading
We prefer to buy if index fall in between 22480 and 22540.
Happy Trading
2013年3月2日星期六
Simplest way to find recent HSI top: 23944.74
Simplest way to find recent top: 23944.74
We can calculated by adding up the 4 biggest accumulated Volume Levels in our weekly charts and divided by 4 as shown below:-
30405
23758
21017
20603
95783/4= 23945.75
JUST FOR FUN:>P
玩得唔Trade得, hehe
Don't be serious!
2013年2月28日星期四
REASONABLE REBOUND
| 新增說明文字 |
1/- C is more or less 1.236 of A=24000-23081=(919X1.236)-23480=22344
2/- time of correction of A=34 hours
time of correction of B&C=89 hours, 89 is 2.618 of 34and both are Fib. Nos.
3/- For extended C wave, Wave 1 (218)=Wave 5 (218)
22581-218=22363 (1=5)
4/- Recent low 22364 touch neckline of big head & shoulder bottom, an intermediate trendline and an adjusted Gann fans touching most of tops & bottoms.
No one knows where the bottom would be but at least we still have some tactics to rely upon. As we can see from the charts that a H & S top formed with its neckline almost the same level as 61.8% rebound of Wave C=23057. Any day close above this level would regard as correction finished.
Happy Trading
2012年6月5日星期二
WHAT DO YOU THINK?
Euro did find some support here, will tension in the stock market be released. Some stocks with higher yield eg. 3988 refused to follow market down.
2012年6月1日星期五
EURO ANALYSIS
US & European Markets crash today but Euro looks stable giving me a sense of divergence. Euro is entering a cluster of reversal time & Price target zone. See how US market react after European Stock market closed !
2012年5月31日星期四
2012年5月21日星期一
TIME ANALYSIS OF FUTURES HOURLY CHART
1/- 121x1.786=218 or 117+101
2/- 84+37+117X0.786=187 or 101+84=185 +/-2
3/- 84x3.618=303.9
or 117+101+84=302 +/- 2
4/- 21764 TO 20444=84 HRS
21244 TO 18448= 84 HRS
2/- 84+37+117X0.786=187 or 101+84=185 +/-2
3/- 84x3.618=303.9
or 117+101+84=302 +/- 2
4/- 21764 TO 20444=84 HRS
21244 TO 18448= 84 HRS
2012年5月18日星期五
Continue buying, FINAL STOP PLACES AT 18300.
OBSERVES 18600/18559/18378/18337 DEPENDING ON HOW MUCH RISK YOU ARE GOING TO TAKE.
2012年5月16日星期三
CAN I DRAW LIKE THIS?
Market over reacted, sure yes!
We prefer buying at this point.
Reason:
1/- we draw the channel as attached chart, its still above the bottom line today.
2/- It had reached from top to 50% or 66% rectracement level (21764-16139/21764-17568)
3/ if ABC correction, C if 1.27 of A
4/- today is the 58th day (93x0.618=57.47 days)
We prefer buying at this point.
Reason:
1/- we draw the channel as attached chart, its still above the bottom line today.
2/- It had reached from top to 50% or 66% rectracement level (21764-16139/21764-17568)
3/ if ABC correction, C if 1.27 of A
4/- today is the 58th day (93x0.618=57.47 days)
2012年5月15日星期二
2012年5月11日星期五
2012年5月7日星期一
EURO SHORT-TERM BOTTOMED
STOP IF NOT CLOSE ABOVE 20500
Market gaps down this morning hitting our stops at 20650 and 20500. (stop #1 and stop#2).
We will close all positions if hsif can't close above 20500.
2012年5月1日星期二
Fibonacci daycount behind ordinary trendlines!
Nikkei and Yen broke their recent lows this morning appearing that it will bring markets further down. But after intensive studies, we discover that the market will hold at these supporting trendlines. And those trendlines are not only drawn by connecting high(s) or low(s) but all being of fibonacci time series important.
Interesting figure as belows:-
1/- Red line =203 days
or
406/2=203
2/- green line 411
or
233x1.764=411 days
3/- blue line=154 days
or
406 x 0.382=155 days +/-1
4/- upper channel line =101
or
406/4=101.5
5/- lower channel line=109
or
173 x0.618=107 days +/-2 days
We are happy to find that and eager to share with someone who likes this blog.
Linked or reproduced are welcomed but please respect writer's endeavour by giving credit to this blog.
Enjoy!
Interesting figure as belows:-
1/- Red line =203 days
or
406/2=203
2/- green line 411
or
233x1.764=411 days
3/- blue line=154 days
or
406 x 0.382=155 days +/-1
4/- upper channel line =101
or
406/4=101.5
5/- lower channel line=109
or
173 x0.618=107 days +/-2 days
We are happy to find that and eager to share with someone who likes this blog.
Linked or reproduced are welcomed but please respect writer's endeavour by giving credit to this blog.
Enjoy!
2012年4月30日星期一
2012年4月27日星期五
May Futures Chart is more informative than Continous Chart
Think Big !
Market did stop near 20127 (19993) level and ended close to our targeted period :mid of April (11/4). Once markets' sentiments is too bearish, contrarian theory applied.
Market momentum is still building up after all those scaring news eg. Euro or china economy. Complex head & shoulders formed. Pullback to NK is finished heading to 24,000 . Chart may also look like Rising Wedge with first and second Zigzag 4068/4196 respectively. If the amplitude of the third Zigzag the same, market will easily reach 24000+.
No matter what, market will inevitably up. We suggest to hold portfolio aiming at 24,000. Time will be in Mid of July or early August.
Forecast is only based on assumptions and with certain constraints. Put your protective stop by using Stop #1 & #2 trendlines.
Happy Trading!
Market momentum is still building up after all those scaring news eg. Euro or china economy. Complex head & shoulders formed. Pullback to NK is finished heading to 24,000 . Chart may also look like Rising Wedge with first and second Zigzag 4068/4196 respectively. If the amplitude of the third Zigzag the same, market will easily reach 24000+.
No matter what, market will inevitably up. We suggest to hold portfolio aiming at 24,000. Time will be in Mid of July or early August.
Forecast is only based on assumptions and with certain constraints. Put your protective stop by using Stop #1 & #2 trendlines.
Happy Trading!
2012年4月16日星期一
BUY WHEN MARKET DIPPED
Hsif rebounded last week closing at its highest level of the week. Clearly one five waves structure is finished with fib.ratio quite matched. 1st wave = 5th wave both 172 pts. and target of wave 5 is 4.236 times of wave 1. See whether fib. rectracement targetS hold. Whats interesting is that 0.382 is just fallen withIN upward channel. 50% level is the area of neckline. 0.618 is the trendline.
Therefore BUY WHEN DIPPED.
2012年4月13日星期五
2012年4月12日星期四
Shanghai (SHICOM) Critical Low ?
Performances of competitors of chinese local banks in China.
Minister Wan said business is so easy for chinese local banks. Yes, sooner or later they have to face competition of foreign banks as their participations are growing . We can see a buying chance for leading foreign bank here.
2012年4月10日星期二
Consider to settle all short positions near 20172
or buy if open stay above 20362 .
2012年4月5日星期四
DON'T BE OVER-PESSIMISTIC !
1/- Retracement level is still within our predicted/acceptable price zone which is still above 20172 indicating it would still be wave 4 (fell to the area of minor wave4 of previous wave 3 or 0.382 level.)
2/- 3-3-5 retracements could be finished unless price broke rectangular pattern resulting in deeper corrections.
3/- low:17568 from 25-11-2011 to top: 21764 of 20-2-2012 is just 55 days.
0.618 of 55 day is 34 days. And today is the 33th day.
4/- Retracement peroids of 25-11-2011 to 9-1-2012 and 20-2-2012 to 30-3-2012 tends to be identical: 29 days unless 20360 is being broken.
5/- recover half of our short position now and settle all positions and think of possible upside strategies if price closed above 20550.
6/- there is no exact correlations between US/Europe/Asian markets. A crumble in the US is not necessarily mean a fall in other markets. It varies from time to time. (please refer to" who is the boss" of this blog.
Happy Trading.
2012年3月14日星期三
訂閱:
文章 (Atom)