

Charts used:
June Chart
Future continuious chart
Future day-night chart
see calculations:-
1a/- 23985-21306=2679x1.618-23436=19101
1b/- 23985-21306=2679x1.618-23178=18843
1a+1b/2=18792
2a/- 23589-20907=2682x1.618-23436=19096
2b/- 23589-20907=2682x1.618-23178=18838
2a+2b/2=18967
3a/- 23985-20907=3078x1.618-23436=18455
3b/- 23985-20907=3078x1.618-23178=18197
3a+3b/2=18326
4a/- 23589-21306=2283x1.618-23436=19742
4b/- 23589-21306=2283x1.618-23178=19484
4a+4b/2=19613
you can see the average minimal target is #4a+4b=19613
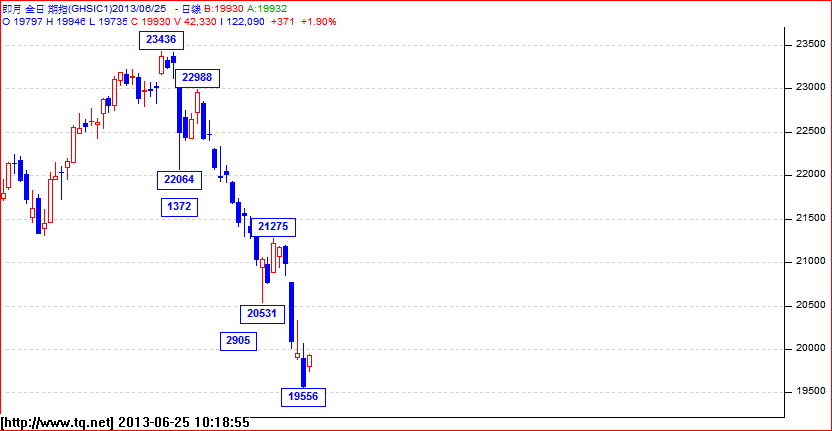
yesterday day session low was 19705
and low of last night is 19556
then 19705+19556/2=19630
compared with average 4ab=19613-19630=17 points only
Long term buyers might buy selectively at this point but be prepared to stand for another 700
points drop.
1 則留言:
Hi, how to calculate the 700points risk ?
thx
發佈留言