
2013年4月19日星期五

2013年4月16日星期二


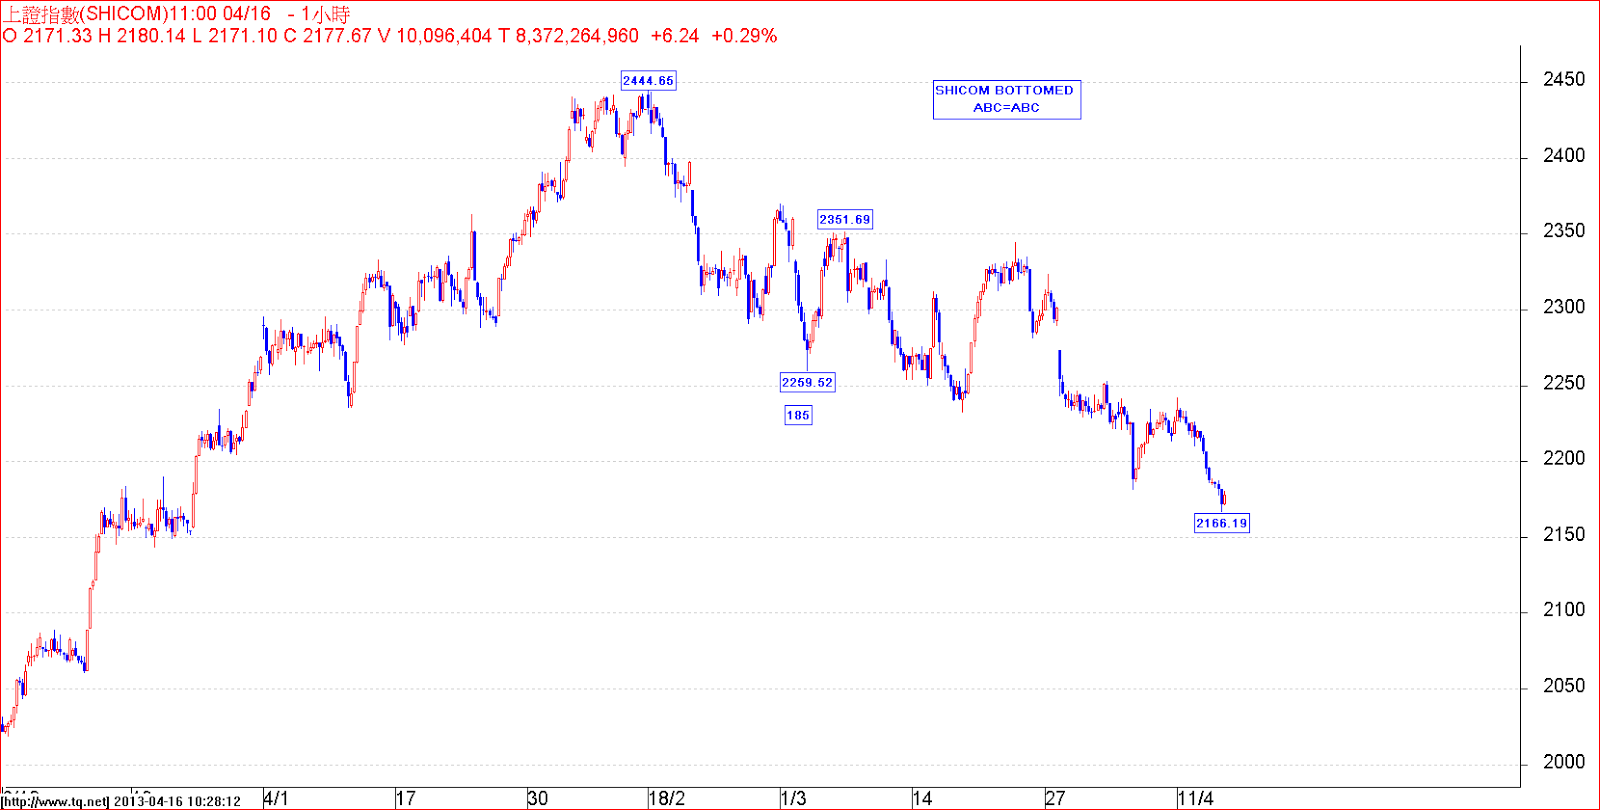
2013年4月15日星期一
2013年4月11日星期四
Minimal April Target 22800

Happy Trading
2013年3月20日星期三
Critical Moment

It touches important trendlnes originated from 18-2-2018. Best to break this trendlines with a gap up!!
2013年3月18日星期一
Looking for a rebound
See this calculations:-
1/- 24000- 22364=1636x0.786=1286-23241=21955
2/- 24000-18649=5351x0.382=2044-24000=21956
3/- 23482-22364=1119x1.382=1119-23483=21936
4/- 24000-22364x1.27-24000=21922


US futures over-reacted.
It could be an important low
Low of today already in, BUY!
2013年3月17日星期日


2013年3月14日星期四

2013年3月13日星期三
LOSING TRADE OF TODAY AND PLAN FOR TOMORROW

This trade caused a lost of 30 points.
Background of trade.
1/- Day closes of the previous two days are above 23050 which is regarded by me as a breakthrough of an uptrend.
2/- One five waves structured of 873 points originated from 22368 was completed topped at 23241 which length of wave 1 equals to wave 5 and 1.382 of the former wave (23001-22364=637x38.2%=243+23001=23244 +/- 3 pts.) A deeper correction was anticipated.
But to my opinion , this finished wave was only a 3-1 wave, only one part of the whole 3rd wave.
3/- 22857 is the intersecting point of the Black and Green Trendlines.
4/- we hoped that, after a rapid intraday correction, it would go back to 23050 once again making 3 days in a row.
Unfortunately, we failed the trade but our lost was limited with a protective stop.
Tomorrow, we will buy again if the open is not lower than today's low 22791.
Trading Range: 23050--22791 = 259
Buying Range: 259/5+22791=<22843 p="">Happy Trading
2013年3月12日星期二
2013年3月9日星期六
USD/Yen Topping?


Yen maybe topping out tonight.
Calculations as belows:-
1/- 82.82-77.10=5.72x2.618=14.97+81.69=96.66
2/- 84.17-76=8.17+88.03=96.20
3/- 84.17-76=8.17x2.382=19.46+77.10=96.56
4/- 84.47-75.54=8.63x2.236=19.29+77.10=96.39
5/- 82.82-77.10=5.72+91.06=96.78
Average=96.66+96.20+96.56+96.39+96.78/5=482.59/96.518
Target:91.06/88.03/86.9/84.6
Stop: 97.50
Happy Trading
2013年3月6日星期三
6-3-2013 HSIF TRADING PLAN

We prefer to buy if index fall in between 22480 and 22540.
Happy Trading
2013年3月2日星期六
Simplest way to find recent HSI top: 23944.74

Simplest way to find recent top: 23944.74
We can calculated by adding up the 4 biggest accumulated Volume Levels in our weekly charts and divided by 4 as shown below:-
30405
23758
21017
20603
95783/4= 23945.75
JUST FOR FUN:>P
玩得唔Trade得, hehe
Don't be serious!
2013年2月28日星期四
REASONABLE REBOUND
 |
| 新增說明文字 |

1/- C is more or less 1.236 of A=24000-23081=(919X1.236)-23480=22344
2/- time of correction of A=34 hours
time of correction of B&C=89 hours, 89 is 2.618 of 34and both are Fib. Nos.
3/- For extended C wave, Wave 1 (218)=Wave 5 (218)
22581-218=22363 (1=5)
4/- Recent low 22364 touch neckline of big head & shoulder bottom, an intermediate trendline and an adjusted Gann fans touching most of tops & bottoms.
No one knows where the bottom would be but at least we still have some tactics to rely upon. As we can see from the charts that a H & S top formed with its neckline almost the same level as 61.8% rebound of Wave C=23057. Any day close above this level would regard as correction finished.
Happy Trading
2012年6月5日星期二
WHAT DO YOU THINK?

2012年6月1日星期五
EURO ANALYSIS


US & European Markets crash today but Euro looks stable giving me a sense of divergence. Euro is entering a cluster of reversal time & Price target zone. See how US market react after European Stock market closed !
2012年5月31日星期四


訂閱:
文章 (Atom)