
2012年3月14日星期三


2012年3月9日星期五

WILL RETRACEMENT CONTINUE?

stop according to how much risk you're going to take.
For timing, I think its still early to say rectracement is finished. Mid point of 45 days cycles is15th or 16th of March.
2012年2月25日星期六

2012年2月20日星期一
2012年2月17日星期五
Time analysis and wave count of HSI Futures


1/- 21574-17778=3796
0.236=20678
0.382=20123
2/- or recent lows=20700 or 20172
Recession Peroid till mid of April
WHO IS THE BOSS?

| ||||||||||||||||||||||||||||||||||||||||||||||||||||||||||||||||||||||||||||||||||||||||||||||||||||||||||||||||||||||||||||||||||||||||||||||||||||||||||||||||||||||||||||||||||||||||||||||||||||||||||||||||||||||||||||||||||||||||||||||||||||||||||||||||||||||||||||||||||||||||||||||||||||||||||||||||||||||||||||||||||||||||||||||||||||||||||||||||||||||||||||||||||||||||||||||||||||||||||||||||||||||||||||||||||||||||||||


2012年2月16日星期四
Today's Pivot of Major Asian Markets
Pivot 2:04PM
Shanghai 2358 2348
Szicom 920 919
Taiwan 7972 7869
Nikkei 9227 9238
Korea 2020 1997
Prices at 2:04PM 16-2-2012
It seems that pnly Nikkei can close above Pivot. Lets observe other markets.
Shanghai 2358 2348
Szicom 920 919
Taiwan 7972 7869
Nikkei 9227 9238
Korea 2020 1997
Prices at 2:04PM 16-2-2012
It seems that pnly Nikkei can close above Pivot. Lets observe other markets.
2012年2月13日星期一
Bullish Gartley

Thanks Yam Sir for inspirations.
http://www.investopedia.com/terms/g/gartley.asp#axzz1mF2GomWm
Hope not " 畫虎不成反類犬"
2012年2月10日星期五
TEST 1: USING HUGE VOLUME LEVEL TO PREDICT PRICE TARGET

USING HUGE VOLUME LEVEL TO PREDICT PRICE TARGET
We can get few targets easily by using fib.ruler.You may find these levels match with targets obtained by simple charting technics.
1/- 1.618 level = short term upward trendline.
2/- 2.618 = previous top
3/- 4.236 = filled last gap
Try to compare performance of Huge vol. top/bottom with simple top/bottom to find target.
Happy Trading.
2012年2月9日星期四

2012年2月6日星期一
SEE HOW PRICE REACTS TO TIME

time:
1/- 8+3+6=17x2.618=44.5
or 8+8+9+3+17=45 (green)
2/- 8x3.618=29
or 9+3+17=29 (blue)
2012年2月3日星期五


2012年2月2日星期四
HSBC: ONE 5 WAVES UP IS FINISHED

Wave 1=60.85-58.55=2.31
2.31x2.618+60.85=66.89
or
wave 1 =2.31
wave 5=2.31+ 64.55 (wave 4 bottom)=66.86
CORRECTIONS CONTINUED

It seems that market is still in forming a irregular wave4 (minor)
a=20686-20172=434
b=434x1.236+20172=20708
or
20571-20172=399 +20287=20686
We are expecting a minor flat c aiming at 20100 or an irregular c bringing market deeper down to 19000+.
In addition, room of going up is limited unless corrections is done.


2012年1月26日星期四
SELL ALL AND EXPECT TO BUY BACK 800-1200 POINTS LOWER

Reasons:-
1/- 871x2.618+18222=20502
2/- 24946-16139x0.5=20542
3/- 1699+19267=20966
1699x0.618+19267=20316
1699x0.764+16267=20565
1699x0.786+19267=20602
1699x1.618+17778=20526
1699x1.382+17778=20126
1141+18919=20060
1141X1.618+18266=20112
Measurements
4068X0.618+18266=20780
20207-17568+18266=20905
AVERAGED ALL FIGURES ABOVE :20500
4/- Time span from 24946 to 16139=224 days
today is 75 days 0r 224x0.333=74.59
2012年1月19日星期四
RECOVERED HALF STAKE FOR THE NEW YEAR

2/- 18649-17778=871X1.618=1409+18222=19631
3/- 19286-18222=1064X0.618=657+18968=19625
4/- 19286-17778=1508X0.618=931+18968=19899
5/- 18968+871=18939
6/- 18968+1141=20109
#1 TO #6 avg 19871
#1+#4+ #5+#6=Avg19993
Recovered within 19871 to 19993
Happy New Year
Regards
2012年1月13日星期五

2012年1月10日星期二


2012年1月3日星期二

2011年12月26日星期一


2011年12月12日星期一
HSBC AND EURO DOUBLED BOTTOM
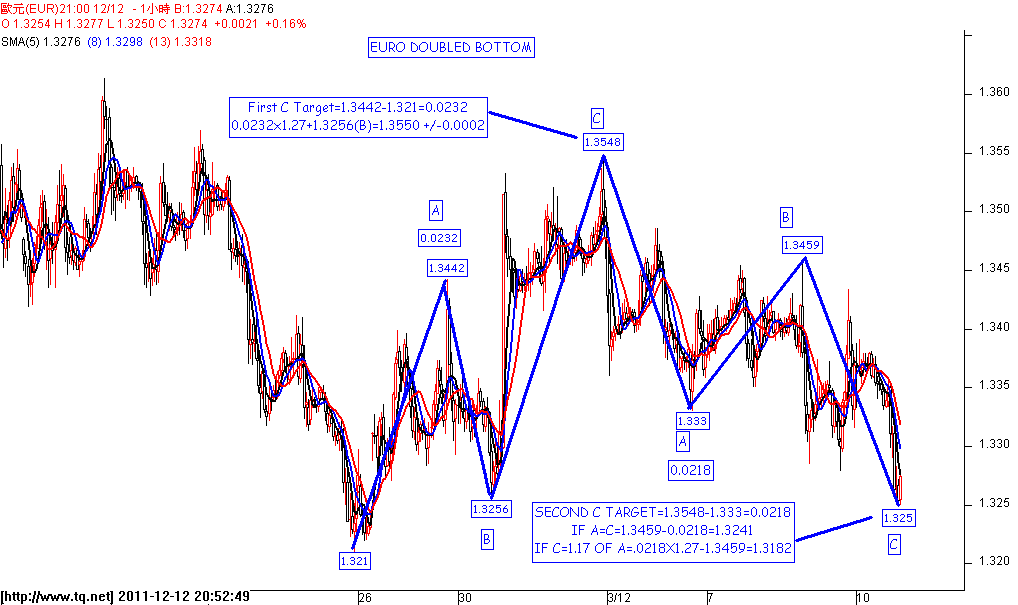
 A five waves structured up is anticipated , bringing both to finish doubled bottom measurable target.
2011年12月3日星期六

2011年11月30日星期三

2011年11月21日星期一
DO YOU BELIEVE IN THESE TRENDLINES?

1224*1.764-20168=18005
other calculations show an average of 17995
18187+18226+18380+18092+18008+17981+17894+17587+17602=17995
use any of the figure above as stop as long as you feel comfortable.
2011年11月17日星期四
Maybe HSBC could find her support here!
 HSBC has been showing her weakness in term of stock price during the past few months. Way to fight back is hard. But I think hsbc could find support here. Rebound target will be 74.25 bringing HSI to 21000+ .
2011年11月9日星期三


2011年10月4日星期二
Strategic Buy, putting stop at 16520

 We buy for the following reasons:-
1/- Hsif made its top 24946 last Nov. dropping to 16716 this morning losing 8230 pts, exactly 33% of its points. 33% is one of the most important retracement level.
2/- Hsif made a ABC correction.
A lasts 34 wks and C lasts 13 weeks closing to Fib. No. of weeks.
3/- Today's low touches an important weekly trendline. We believe that a sizable rebound is expected.
4/- For target wave count, please see attached hourly chart. Different calculations obtain same result 167xx.
5/- We use 16520 as a stop because we include the possibility of 24946 as an irregular B top of the last wave. 18922 was A, 24946 was B and C assumes 1.382 of B =(24946-18922)x1.382-24946=16220. therefore we put 100 pts lower of 16620 as a stop.
6/-
訂閱:
文章 (Atom)