2013年6月26日星期三
2013年6月25日星期二


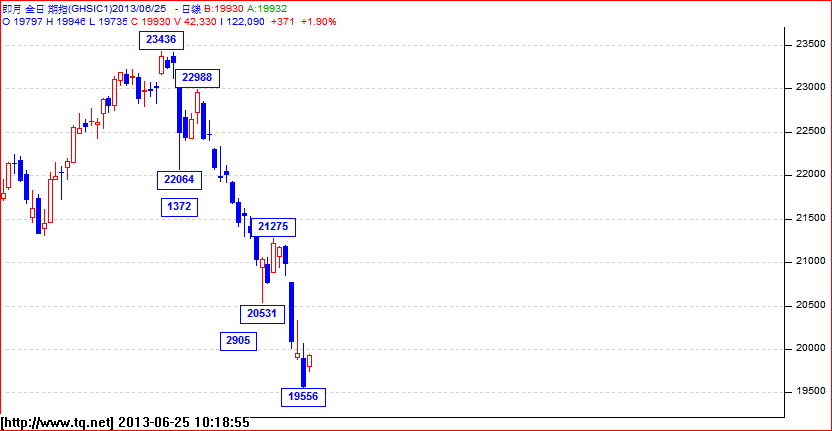
Minimum 1.618 target reached: Using 1.618 target projection with Various Highs & Lows


Charts used:
June Chart
Future continuious chart
Future day-night chart
see calculations:-
1a/- 23985-21306=2679x1.618-23436=19101
1b/- 23985-21306=2679x1.618-23178=18843
1a+1b/2=18792
2a/- 23589-20907=2682x1.618-23436=19096
2b/- 23589-20907=2682x1.618-23178=18838
2a+2b/2=18967
3a/- 23985-20907=3078x1.618-23436=18455
3b/- 23985-20907=3078x1.618-23178=18197
3a+3b/2=18326
4a/- 23589-21306=2283x1.618-23436=19742
4b/- 23589-21306=2283x1.618-23178=19484
4a+4b/2=19613
you can see the average minimal target is #4a+4b=19613
yesterday day session low was 19705
and low of last night is 19556
then 19705+19556/2=19630
compared with average 4ab=19613-19630=17 points only
Long term buyers might buy selectively at this point but be prepared to stand for another 700
points drop.
2013年6月24日星期一

2013年6月21日星期五
looking for a rebound
Amended: should minus 1000 point:>P
19830+
19795
20300-20500
Buying Range: 20830+
Stop:20795
T昭圾: 21300-21500
19830+
19795
20300-20500
Buying Range: 20830+
Stop:20795
T昭圾: 21300-21500
2013年6月13日星期四
2013年6月6日星期四
Bear or Bull? lets the market told you !

Lets see explainations below:-
price:
1/- 23178-22851x4.236=21592
2/- 23178-22140-22650=21614
3/- 23178-219890.618 -22338=21603
4/- Average high of Apr,may =23178+23436/=2=23307
Average low of apr,may,jun
20907+21180+21306/3=21131
then 23307-21131=2176x0.786-23307=21596
Avg. of 1-4=21592+21614+21603+21596/4=21601.
Time: up time from April's low is 21 days
21 day x 0.618=12.97 days and today is the 12th day.
some astro cycles highly matched with this swing.
20/4 Mercury/Uranus conjuction (last low)
20/5 mercury/uranus 60 (last top)
8/6 mercury/usanus 90 (possible low)
today is also neptune retro
see how much astro power could help for this reversal.
Pattern:
Can you see a wedge forming?
Happy Trading.
2013年6月4日星期二


2013年6月3日星期一
ANOTHER BUYING OPPORTUNITY THIS MORNING,
0.618 level is 22770 level and A=C is 22600+
Ideal call 22000 call
Ideal call 22000 call
訂閱:
留言 (Atom)